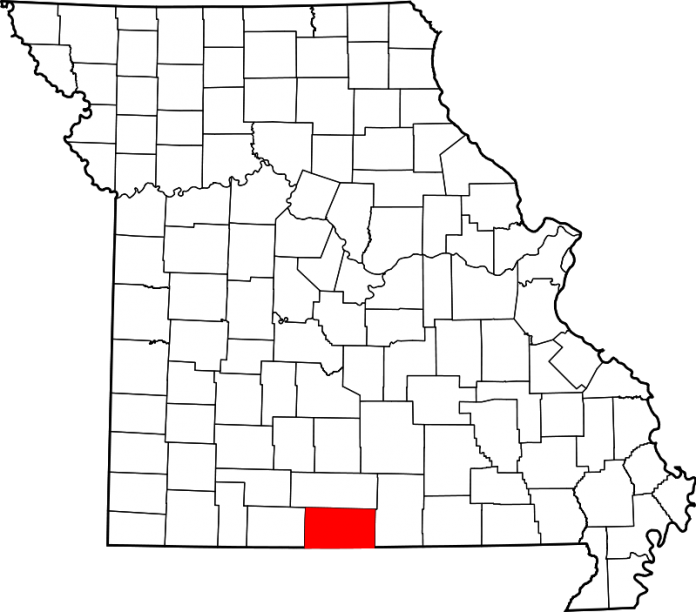
Election results for the November 8, 2022 General Election for Ozark County, Missouri.
Uncontested races will not be listed.
Disclaimer – These election results are not the final results. The official final results will be available in the following days.
Advertisement
Courtesy of the Secretary of States website
| U.S. Senator | 10 of 10 Precincts Reported | ||
| Eric Schmitt | Republican | 2,957 | 79.941% |
| Trudy Busch Valentine | Democratic | 610 | 16.491% |
| Jonathan Dine | Libertarian | 73 | 1.974% |
| Paul Venable | Constitution | 56 | 1.514% |
| Write-in | Write-in | 3 | 0.081% |
| Nathan Mooney | Write-in | 0 | 0.000% |
| Theo Brown | Write-in | 0 | 0.000% |
| David Kirk | Write-in | 0 | 0.000% |
| Gina Bufe | Write-in | 0 | 0.000% |
| Martin Lindstedt | Write-in | 0 | 0.000% |
| Rik Combs | Write-in | 0 | 0.000% |
| Steve Price | Write-in | 0 | 0.000% |
| Total Votes: | 3,699 | ||
| State Auditor | 10 of 10 Precincts Reported | ||
| Scott Fitzpatrick | Republican | 3,084 | 83.964% |
| Alan Green | Democratic | 496 | 13.504% |
| John A. Hartwig Jr. | Libertarian | 92 | 2.505% |
| Write-in | Write-in | 1 | 0.027% |
| Arnie C. Dienoff | Write-in | 0 | 0.000% |
| Total Votes: | 3,673 | ||
| U.S. Representative – District 8 | 10 of 10 Precincts Reported | ||
| Jason Smith | Republican | 3,118 | 84.613% |
| Randi McCallian | Democratic | 491 | 13.324% |
| Jim Higgins | Libertarian | 76 | 2.062% |
| Total Votes: | 3,685 | ||
| State Representative – District 155 | 10 of 10 Precincts Reported | ||
| Travis Smith | Republican | 3,286 | 100.000% |
| Total Votes: | 3,286 | ||
| Missouri Supreme Court | 10 of 10 Precincts Reported | ||
| Zel M Fischer | Yes Votes | 2,375 | 76.588% |
| No Votes | 726 | 23.412% | |
| Total Votes: | 3,101 | ||
| Robin Ransom | Yes Votes | 2,291 | 74.577% |
| No Votes | 781 | 25.423% | |
| Total Votes: | 3,072 | ||
| Court of Appeals – Southern District | 10 of 10 Precincts Reported | ||
| Don Burrell | Yes Votes | 2,374 | 77.279% |
| No Votes | 698 | 22.721% | |
| Total Votes: | 3,072 | ||
| Jack Goodman | Yes Votes | 2,390 | 77.698% |
| No Votes | 686 | 22.302% | |
| Total Votes: | 3,076 | ||
| Constitutional Amendment 1 | 10 of 10 Precincts Reported | ||
| YES | 1,562 | 44.629% | |
| NO | 1,938 | 55.371% | |
| Total Votes: | 3,500 | ||
| Constitutional Amendment 3 | 10 of 10 Precincts Reported | ||
| YES | 1,455 | 39.624% | |
| NO | 2,217 | 60.376% | |
| Total Votes: | 3,672 | ||
| Constitutional Amendment 4 | 10 of 10 Precincts Reported | ||
| YES | 2,311 | 64.825% | |
| NO | 1,254 | 35.175% | |
| Total Votes: | 3,565 | ||
| Constitutional Amendment 5 | 10 of 10 Precincts Reported | ||
| YES | 2,388 | 67.841% | |
| NO | 1,132 | 32.159% | |
| Total Votes: | 3,520 | ||
| Constitutional Convention Question | 10 of 10 Precincts Reported | ||
| YES | 914 | 26.424% | |
| NO | 2,545 | 73.576% | |
| Total Votes: | 3,459 |


